GPU Carbon Calculator Explained
We've added a GPU carbon calculator to our website. This fun little feature gives you insight into the emissions reduction that can be achieved using Leafcloud GPUs as opposed to those run in regular data centers
By
Published on
We’ve added a GPU carbon calculator to our website. This fun little feature gives you insight into the emissions reduction that can be achieved using Leafcloud GPUs as opposed to those run in regular data centers. It’s probably the most visible additional functionality on the new website and we want to be clear about what it shows you and, perhaps more importantly, what it doesn’t. In this blog, we’ll dive into the following:
- How the calculator works
- Our methodology
- What it shows you
- What it doesn’t (yet)
Carbon-negative?
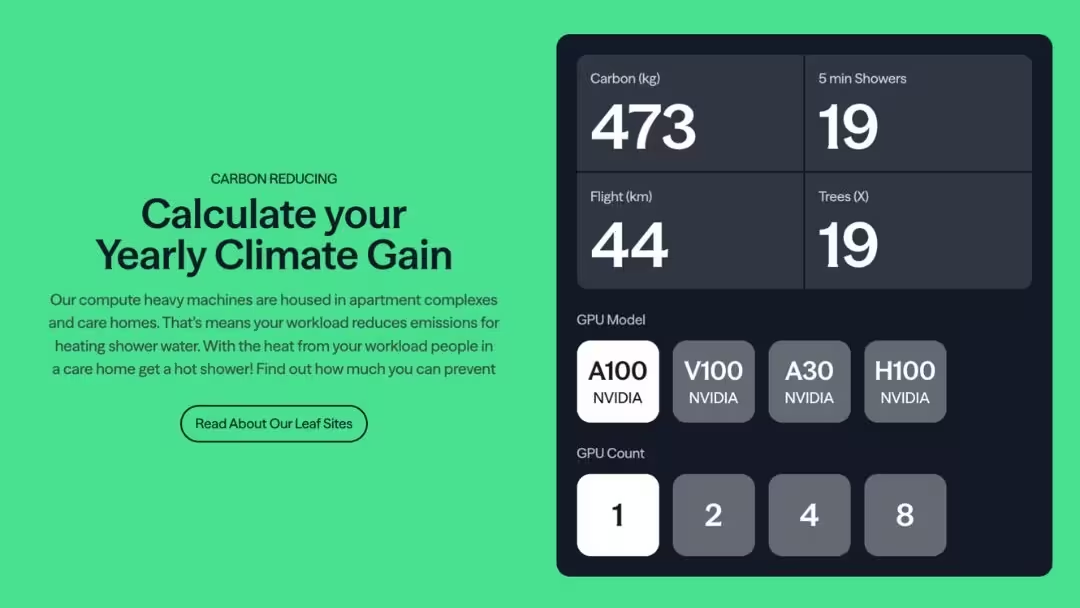
The first thing you’ll probably notice is that all the configurations display a carbon saving figure.
Does that mean they actively reduce emissions?
Yes, they do. The short – but incomplete – explanation is that your workload has a negative footprint at our Leaf sites, where the heat is used to prevent otherwise necessary natural gas use.
So, are they carbon-negative?
No, this doesn’t mean we’re claiming our servers are inherently carbon-negative, that might give the impression that they somehow don’t use energy and/or can magically pull carbon out of the air.
However, they do currently reduce the total societal GHG (greenhouse gas) emissions. We achieve this by reducing the amount of natural gas used to heat water at the locations where the GPUs are housed. Replacing natural gas with server heat generated with green energy.
Additionally, if you were to move an existing workload out of a traditional data center and onto Leafcloud, that would also reduce the emissions (and water usage) attributed to cooling the server in that data center, as we keep the GPUs cool without the additional energy and water used in most data centers. Hence the negative total emissions – or carbon savings -displayed on the calculator. You can read more about our unique Leaf site solution here: leaf.cloud/truly-green.
Our methodology
What can you take into account when calculating the carbon emissions generated by a GPU? Well, there’s the type and amount of energy it uses, the embedded emissions in building it and the required housing for it, the additional infrastructure required. Then there’s energy consumption variations both in the types of GPUs and the individual cards themselves. On top of that, the energy used by the card varies between peak usage and spin up and spin down moments.
So, how do we generate the values it displays and what can they tell us. First off, the calculator applies to the Nvidia A30, A100, H100, and RTX6K (RTX PRO 6000 Blackwell Server Edition, coming early 2026) GPUs in the configurations run at our Leaf sites.
Coming Soon: NVIDIA Blackwell RTX PRO 6000 on Leafcloud
Next-generation GPU compute for AI inference, media processing, and accelerated analytics—available on European, climate-positive infrastructure. Learn more about Blackwell availability →
To arrive at the given carbon metric, we take the total energy used by a GPU run for a year, calculate the resulting heat the GPU generates for heating the building’s water, and translate that into the amount of carbon emissions that would be produced by the equivalent amount of natural gas.
The carbon footprint of running the servers using green energy is tallied and the ‘saved’ or ‘prevented’ natural gas emissions subtracted.
Then we compare those avoided emissions to the equivalent number of fully grown trees required to do the same, the number of kilometers in an airplane one could travel, and the number of 5-minute showers one could take to produce the same emissions.
Here’s our methodology, including assumptions and data sources:
- carbon_per_kwh_grams: 536 https://www.co2emissiefactoren.nl/lijst-emissiefactoren/
- vcpu_wattage: 4
- vcpu_idle_wattage: 1
- carbon_reduction_per_tree_year_grams: 25000 https://ecotree.green/nl/hoeveel-co2-neemt-een-boom-op#:~:text=Een%20boom%20neemt%20ongeveer%2025,afhankelijk%20van%20een%20heleboel%20factoren.
- carbon_per_flight_km_grams: 10700 https://www.eeagrants.gov.pt/media/2776/conversion-guidelines.pdf
- carbon_per_m3_gas_grams: 2130 https://www.co2emissiefactoren.nl/lijst-emissiefactoren/
- gas_per_shower_m3: 0.2 https://pure-energie.nl/kennisbank/stroomverbruik-apparaten/hoeveel-gas-verbruik-je-met-douchen/
- leafcloud_heat_recovery_fraction: 0.8
- hours: 8760
- average_power_usage_fraction: 0.42
- name: A100
- vendor: NVIDIA
- wattage: 300
- name: A30
- vendor: NVIDIA
- wattage: 165
- name: H100
- vendor: NVIDIA
- wattage: 700
- name: RTX6K
- vendor: NVIDIA
- wattage: 500
As you can see, we use various assumptions, verified product data, and several constants to create an approximation. The heat recovery fraction for instance, is set at 0.8 or 80% of the total energy consumed. This is an average recovery rate across various setups and locations. Likewise, the vCPU wattage is an average of the various CPUs in operation.
What this calculator doesn’t show you
Clearly, our methodology is not comprehensive, as several factors are not considered. Our calculator, while making the energy used by GPUs more tangible, provides a rough impression. Things it doesn’t show you include:
- Real-time insight, Spin up and Spin down variance, and hardware fluctuations
- Exact figures for each specific card in the slightly variant locations they are housed
- Embedded carbon in hardware and additional infrastructure
- Exact recovery rate per rack housing GPUs
- Anything more than an approximation
Why not (yet)?
The simple answer is we haven’t gotten round to sourcing, installing, and automating all the required data gathering, monitoring, and tooling for these aspects… yet.
Some of these questions will remain hard to answer and it’s incumbent on us to keep finding more comprehensive methodologies. We should all be open about what we don’t know and where there’s still work to be done.
Feel free to let us know which metrics we may have forgotten to take into account and use your own carbon intensity metrics and tools. Share the results with us, we’re keen to find out.
related